Hey, I'm
From raw data to board-ready insights. I architect SQL data pipelines,
build star schema models, and deliver Power BI dashboards that drive real decisions —
not just pretty charts.
Power BI · SQL · Python · DAX
Most dashboards answer the question that was asked.
The best ones answer the question the business didn't know it had.
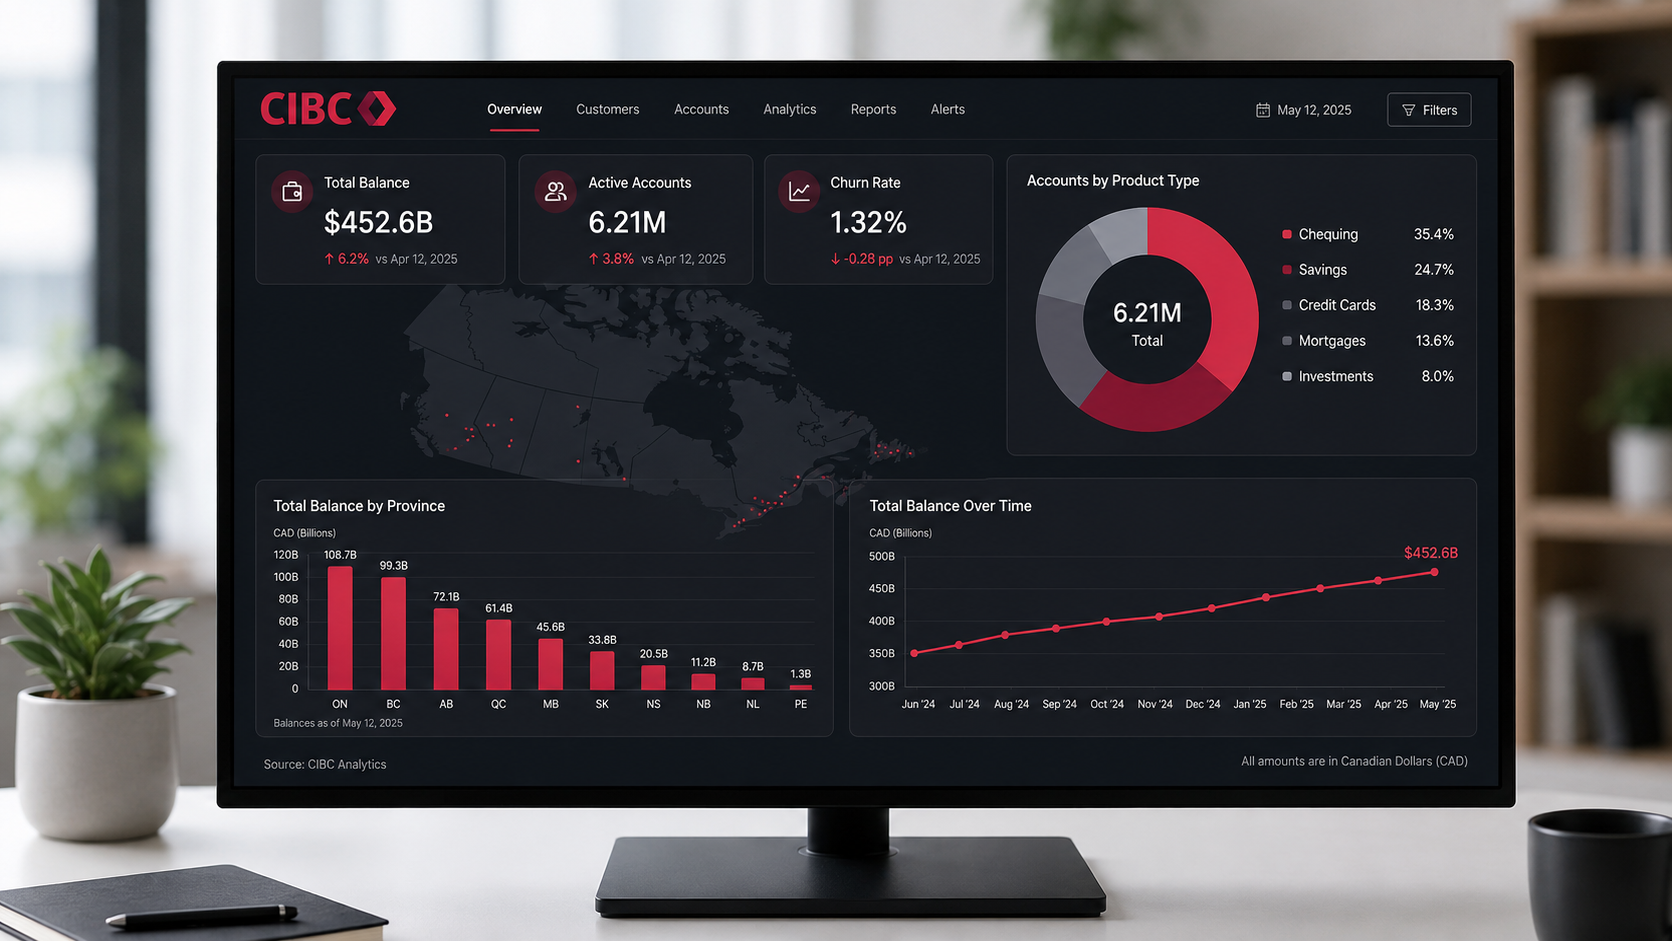
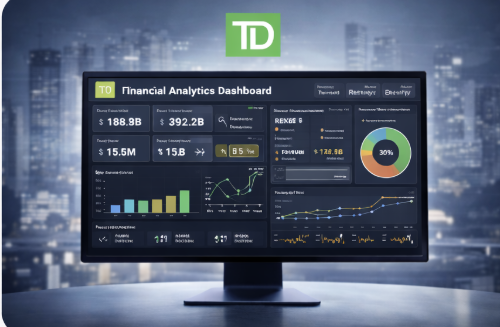
I'm a Data Analyst who works across the full analytics stack — designing SQL data architectures, building star schema models, writing Python pipelines, and delivering executive Power BI dashboards that actually drive decisions.
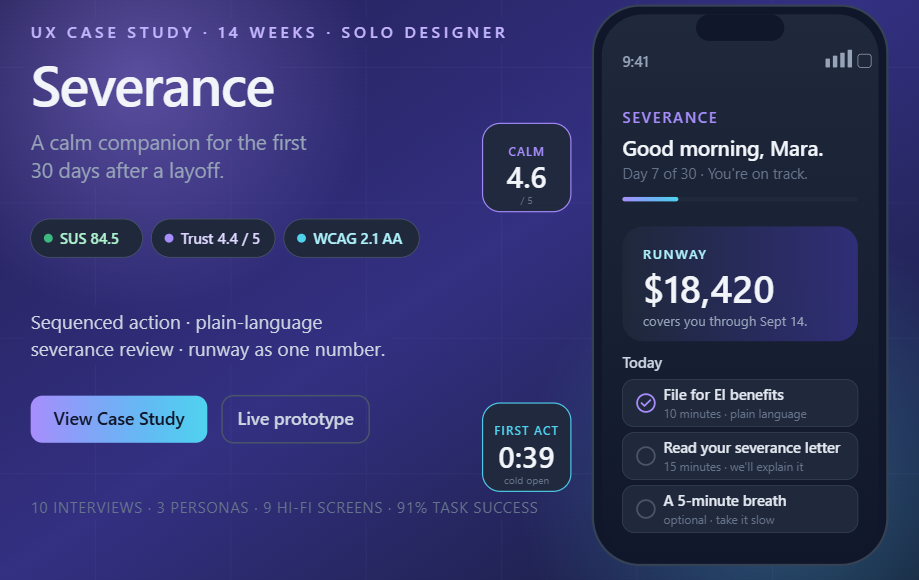
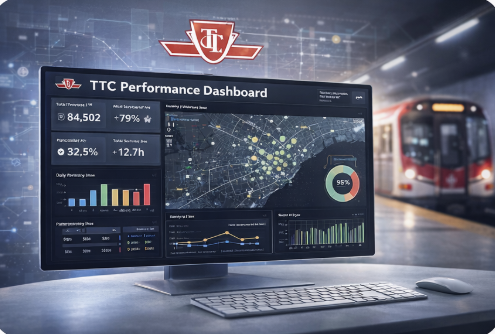
My projects span telecom churn risk, transit geospatial intelligence, healthcare ER analytics, and a full UX case study on layoff recovery — each built end-to-end: raw data in, board-ready insight out.
UX Case Study
A digital companion for the first 30 days after a layoff — sequenced action, plain-language severance review, runway as a single number, and a graceful exit when no longer needed. 14-week sole-designer build: 10 generative interviews, 5-phase journey map, 9 hi-fi screens. SUS 84.5, 91% task success, 4.4 / 5 trust, WCAG 2.1 AA on every screen.
View Case Study
Data Analysis
16.52% of 10,000+ CIBC credit card customers are churning — this dashboard shows exactly who, where, and why. Engineered 8 custom features in Python (churn flags, risk tiers, provinces), uncovered patterns across income tiers, card types, and 6 Canadian provinces via SQL & Jupyter EDA, then shipped a boardroom-ready Power BI dashboard with real banking KPIs, CIBC branding, and interactive slicers.
View Project
Data Analysis
Analyzed 63,000+ transit incidents and 1M+ delay minutes across Toronto's TTC network. Built a 3-layer executive dashboard covering KPI monitoring, route risk classification, and 3D Azure Maps geospatial hotspot mapping.
View Project
Data Analysis
Designed a 3-layer SQL architecture (staging → core → analytics mart) to model raw telecom data. Identified month-to-month contracts and sub-12-month tenure as strongest churn predictors through structured risk segmentation.
View Project
Data Analysis
Built a complete Python analytics pipeline on ER patient data — from raw ingestion through feature engineering, EDA, and K-Means clustering. Segmented patient visits by age, wait time, and satisfaction to surface peak demand periods and department gaps.
View Project
Dashboard
TD-inspired executive dashboard analyzing credit card customer churn risk. Applied star schema modeling and a rule-based churn risk engine to segment customers into Low, Medium, and High risk tiers across income and spending profiles.
View Dashboard
Dashboard
Netflix-style analytics dashboard built end-to-end using Python for data generation and Power BI for visualization. Star schema modeling with DAX measures tracking watch hours, MAU, revenue, and churn across device types and content genres.
View Dashboard
Software
Published a production-ready VS Code extension on the official Marketplace. Performs real-time AI code analysis, refactoring suggestions, and plain-language explanations using local LLMs — runs completely offline via LM Studio.
View Code
Software
End-to-end ML web app using Logistic Regression to classify text as positive, neutral, or negative in real time. Includes a full data preprocessing pipeline and interactive Streamlit UI with live prediction visualization.
View CodeMy GitHub activity updates automatically from my public GitHub profile — live contributions, real commits.


Whether you need a Power BI dashboard, a SQL data architecture, a Python analytics pipeline, or a thoughtful UX case study — I build it end-to-end. Let's talk.